Here are the details of the economic calendar for December 24, 2021:
The previous week closed conditionally on a holiday, and so, the United States, Great Britain, Germany, Italy, Spain, and Switzerland were not around. Meanwhile, there was an early closure in other parts of Europe. As a result, the quotes stayed in one place.
Analysis of trading charts from December 24:
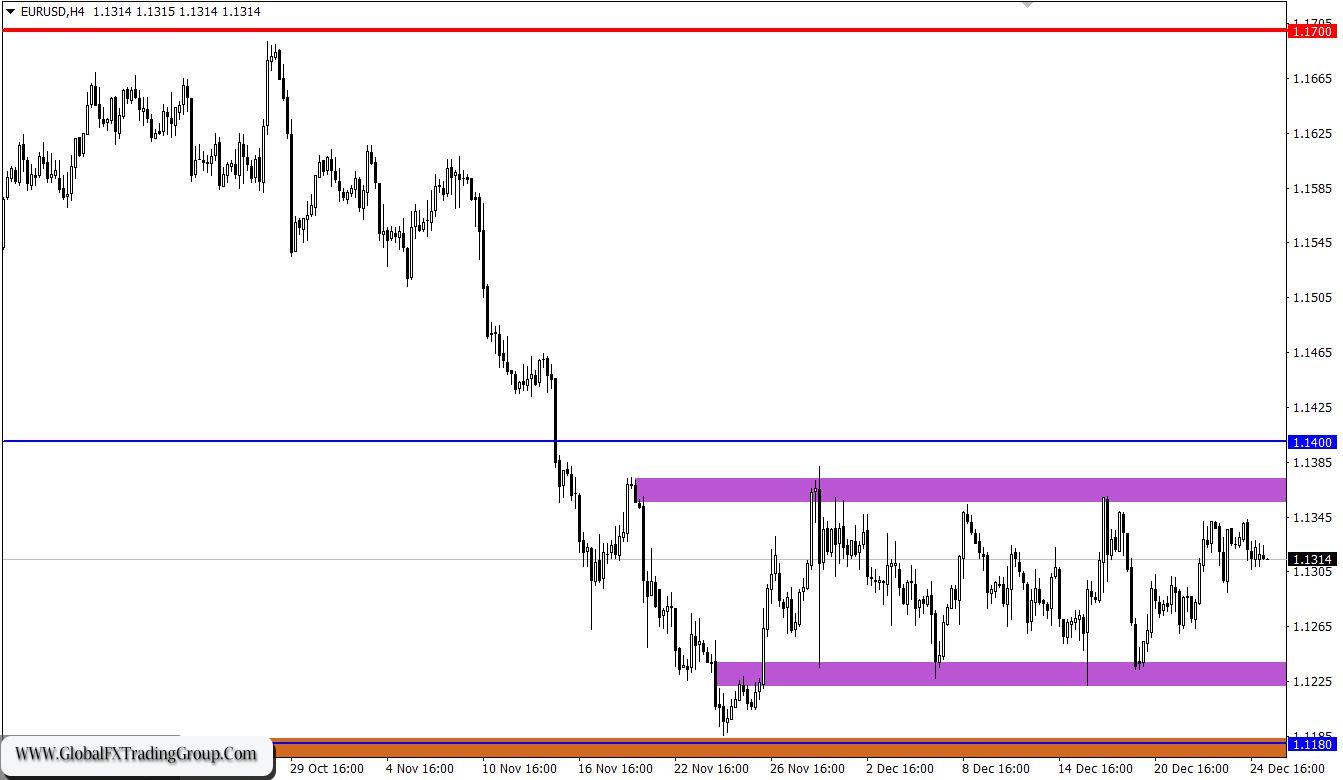
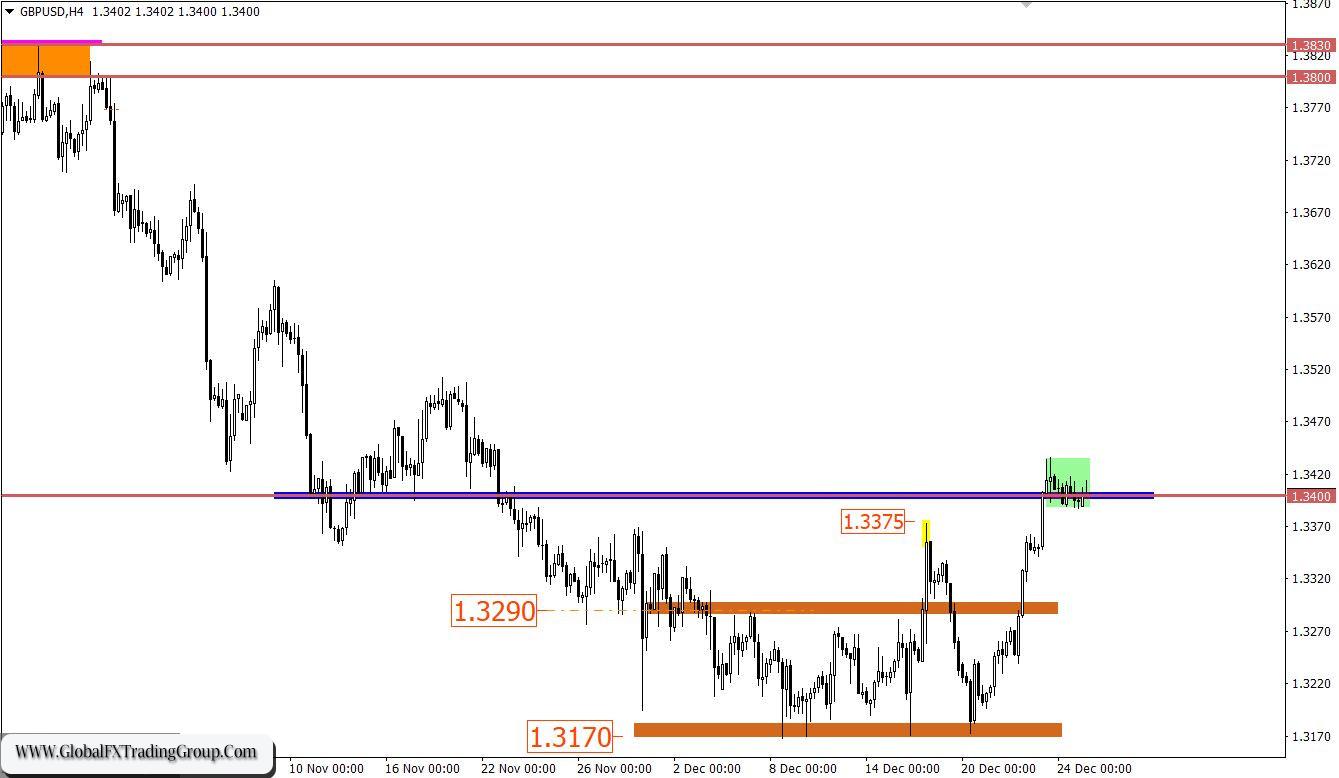
The EUR/USD pair still moves within the sideways channel of 1.1225/1.1355, where the area of the upper border acts as resistance. Therefore, the stagnation between December 23 and 24 may indicate a reduction in the volume of long positions. This increases the chance of rebounding from the resistance area. The pound sterling gained more than 250 points against the US dollar last week.
As a result, the quote reached the resistance area of 1.3400/1.3420, where there was initially a pullback and then stagnation. There is a still downward trend relative to the daily period despite a fairly strong price surge. The upward movement may turn out to be a correction.
December 27 economic calendar: The new trading week starts with an empty macroeconomic calendar and a day-off from the UK. In this situation, only spontaneous speculative interest, if any, can save the market.
Trading plan for EUR/USD on December 27:
Trading tactics based on the borders of the sideways channel are still relevant among traders. Therefore, the rebound method is considered as a primary strategy, where the quote has already slowed down the movement within the upper frame. If expectations coincide, a movement towards the range of 1.1280-1.1240 may occur.
The most profitable tactic is breaking one or another border of the range, but it takes more time for its execution than just a rebound.
Trading plan for GBP/USD on December 27:
In this situation, everything points to the pound’s sale, but it is not necessary to rush. The signal for action will come from the market only after holding the price below the level of 1.3380 in a four-hour period. This scenario may lead to a decline towards 1.3290.
An alternative scenario considers the prolongation of the corrective move towards 1.3510-1.3575-1.3600. To implement this, the quote needs to stay above the level of 1.3450 in a four-hour period.
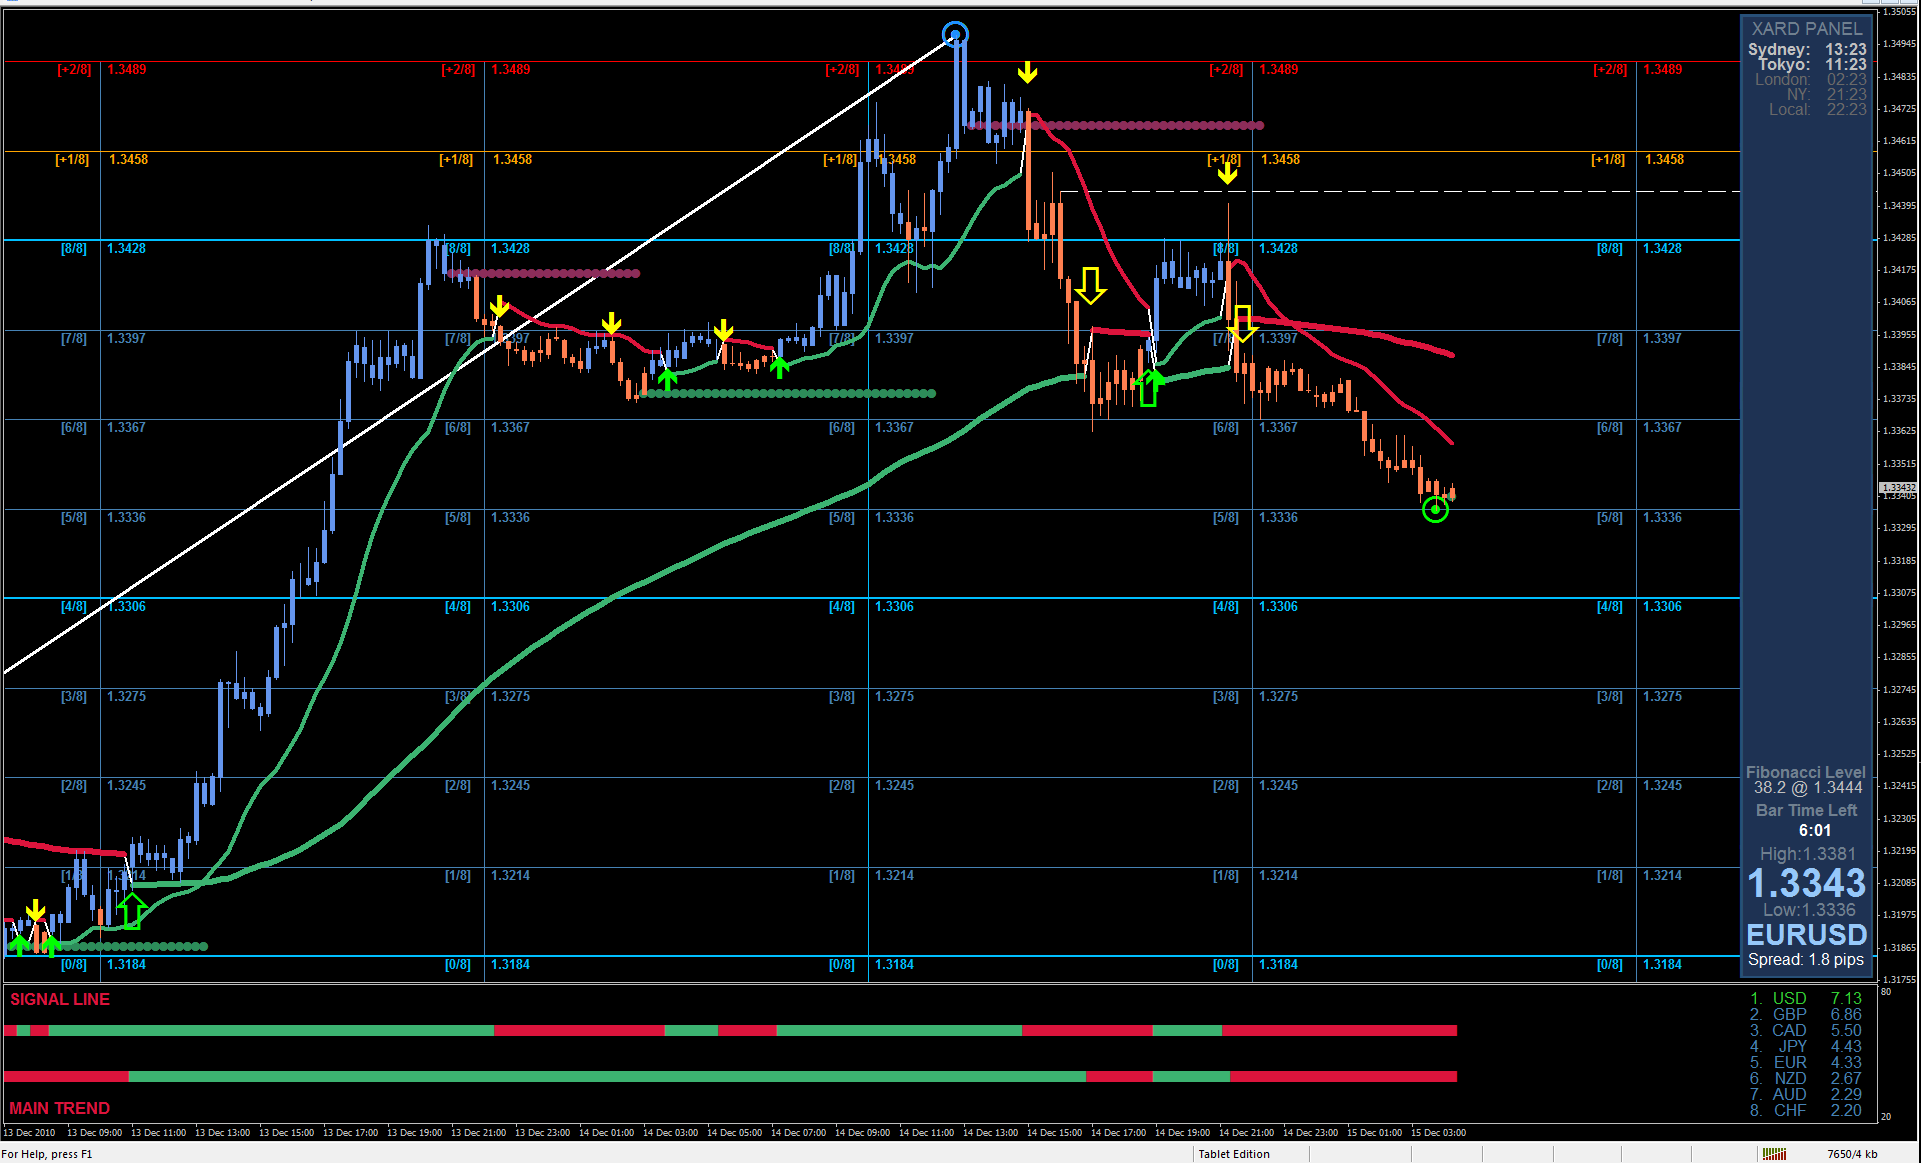
A candlestick chart view is graphical rectangles of white and black light, with sticks on top and bottom. When analyzing each candle in detail, you will see its characteristics of a relative period: the opening price, closing price, and maximum and minimum prices. Horizontal levels are price coordinates, relative to which a stop or a price reversal may occur. These levels are called support and resistance in the market.
Circles and rectangles are highlighted examples where the price of the story unfolded. This color selection indicates horizontal lines that may put pressure on the quote in the future. The up/down arrows are the reference points of the possible price direction in the future.
*The market analysis posted here is meant to increase your awareness, but not to give instructions to make a trade.
If you have an interest in any area of Forex Trading, this is where you want to be.
Global Fx Trading Group is a world leader in providing Fx services to individual traders, including: Unmatched funding programs, on-line education, virtual trading rooms, automation tools, robot building, and personal coaching.
The company was first established by Jeff Wecker, former member of the Chicago Board of Trade, with 25 years in the industry. Jeff has a keen understanding of the needs of Forex traders and those needs are our focus.
Please join our VIP Group while is still FREE …
https://t.me/joinchat/JqsXFBKpyj3YS4bLWzT_rg
Our mission is simple: To enhance as many lives as we can through education and empowerment.
#theforexarmy #forexsigns #forexsignals #forexfamily #forexgroup #forexhelp #forexcourse #forextrade #forexdaily #forexmoney #forexentourage #forextrading #forex #forexhelptrading #forexscalping #babypips #forexfactory #forexlife #forextrader #financialfreedom