Here are the details of the economic calendar for November 25, 2021:
Yesterday was a non-working day in the United States in celebration of Thanksgiving. Meanwhile, Europe and Britain did not publish important statistics. For this reason, the dynamics in the market were minimal.
Analysis of trading charts from November 25:
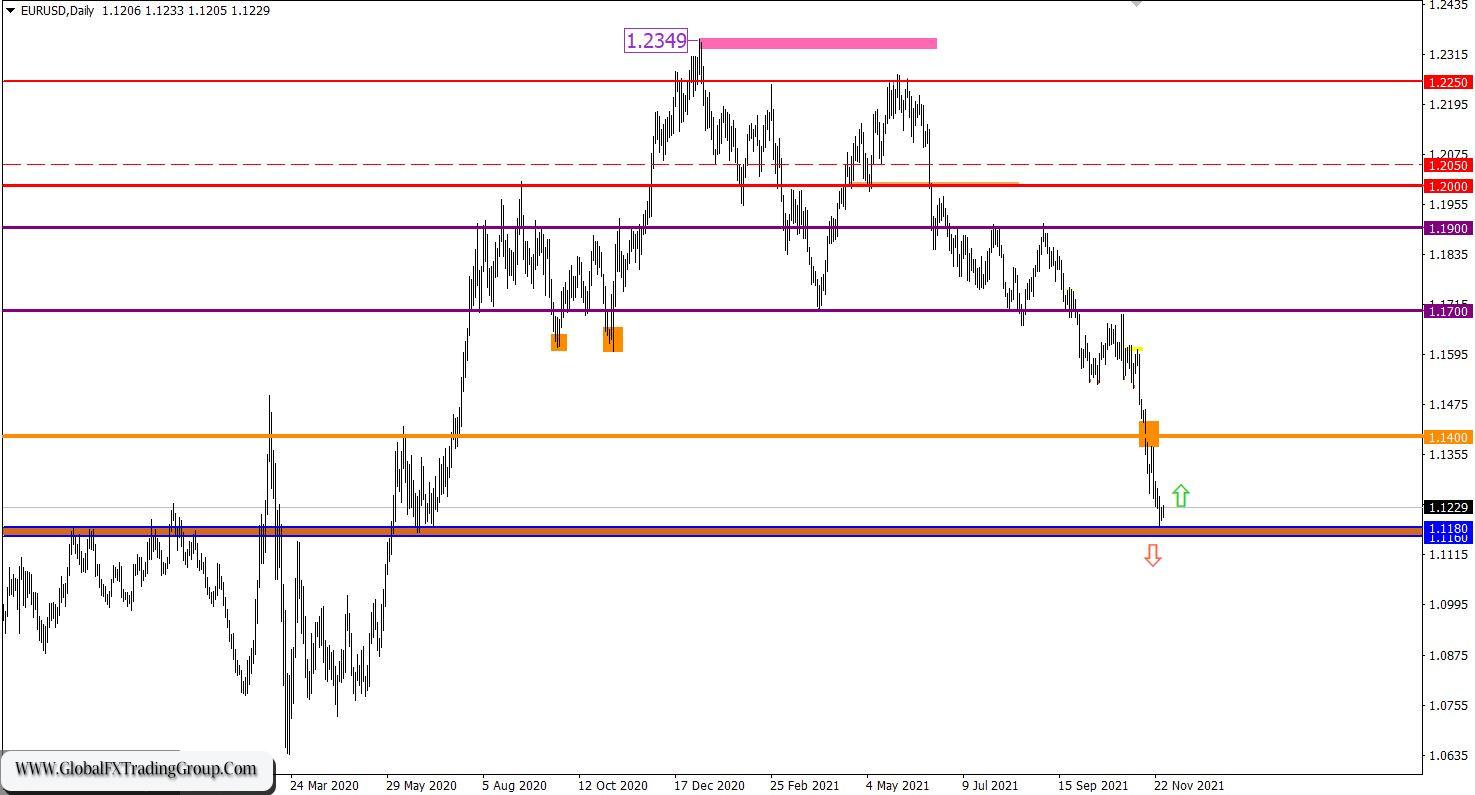
The EUR/USD pair formed a pullback-stagnation after the price converged with the support area of 1.1160/1.1180, while not reducing the volume of short positions. Despite the growing level of the oversold euro, there is no full-size correction move in the market. This indicates a high interest of speculators in the current market situation. The daily chart shows the overheating short positions due to the rapid depreciation of the euro over the past few weeks.
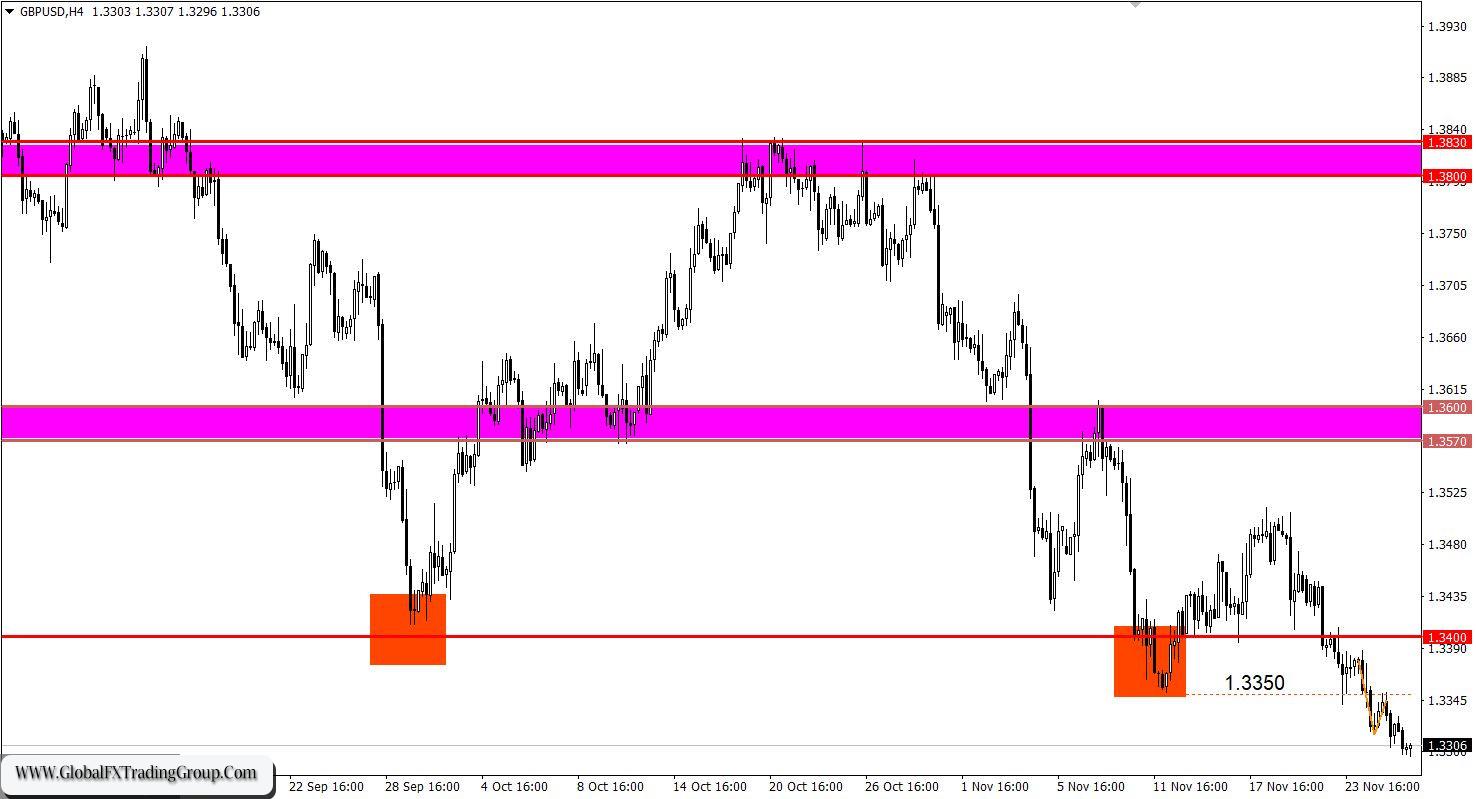
The GBP/USD pair applied a breakdown-pullback pattern relative to the level of 1.3350, working it out as resistance. This led to an increase in the volume of short positions in the direction of 1.3300. Despite the fifth day of the depreciation of the pound sterling, the oversold status is not observed in the four-hour and daily periods. The trading plan on November 25 considered the possibility of a subsequent weakening of the pound if the price is held below the level of 1.3350.
November 26 economic calendar: There is an early closing in the United States today at 10:00 Universal time due to the Thanksgiving celebration. As for Europe and the UK, the macroeconomic calendar is completely empty again. For this reason, one should not expect anything extraordinary from the market.
Trading plan for EUR/USD on November 24:
The risk of a technical correction remains on the market until the support area of 1.1160/1.1180 is broken. This may well partially remove the oversold status from the euro. Traders will consider subsequent sell positions when the price is kept below the level of 1.1150 in a four-hour period.
Trading plan for GBP/USD on November 26:
It can be assumed that the downward cycle is still relevant in the market. The subsequent growth in the volume of short positions is expected when the price is kept below the level of 1.3290. This will open the way towards the 1.3150 mark.
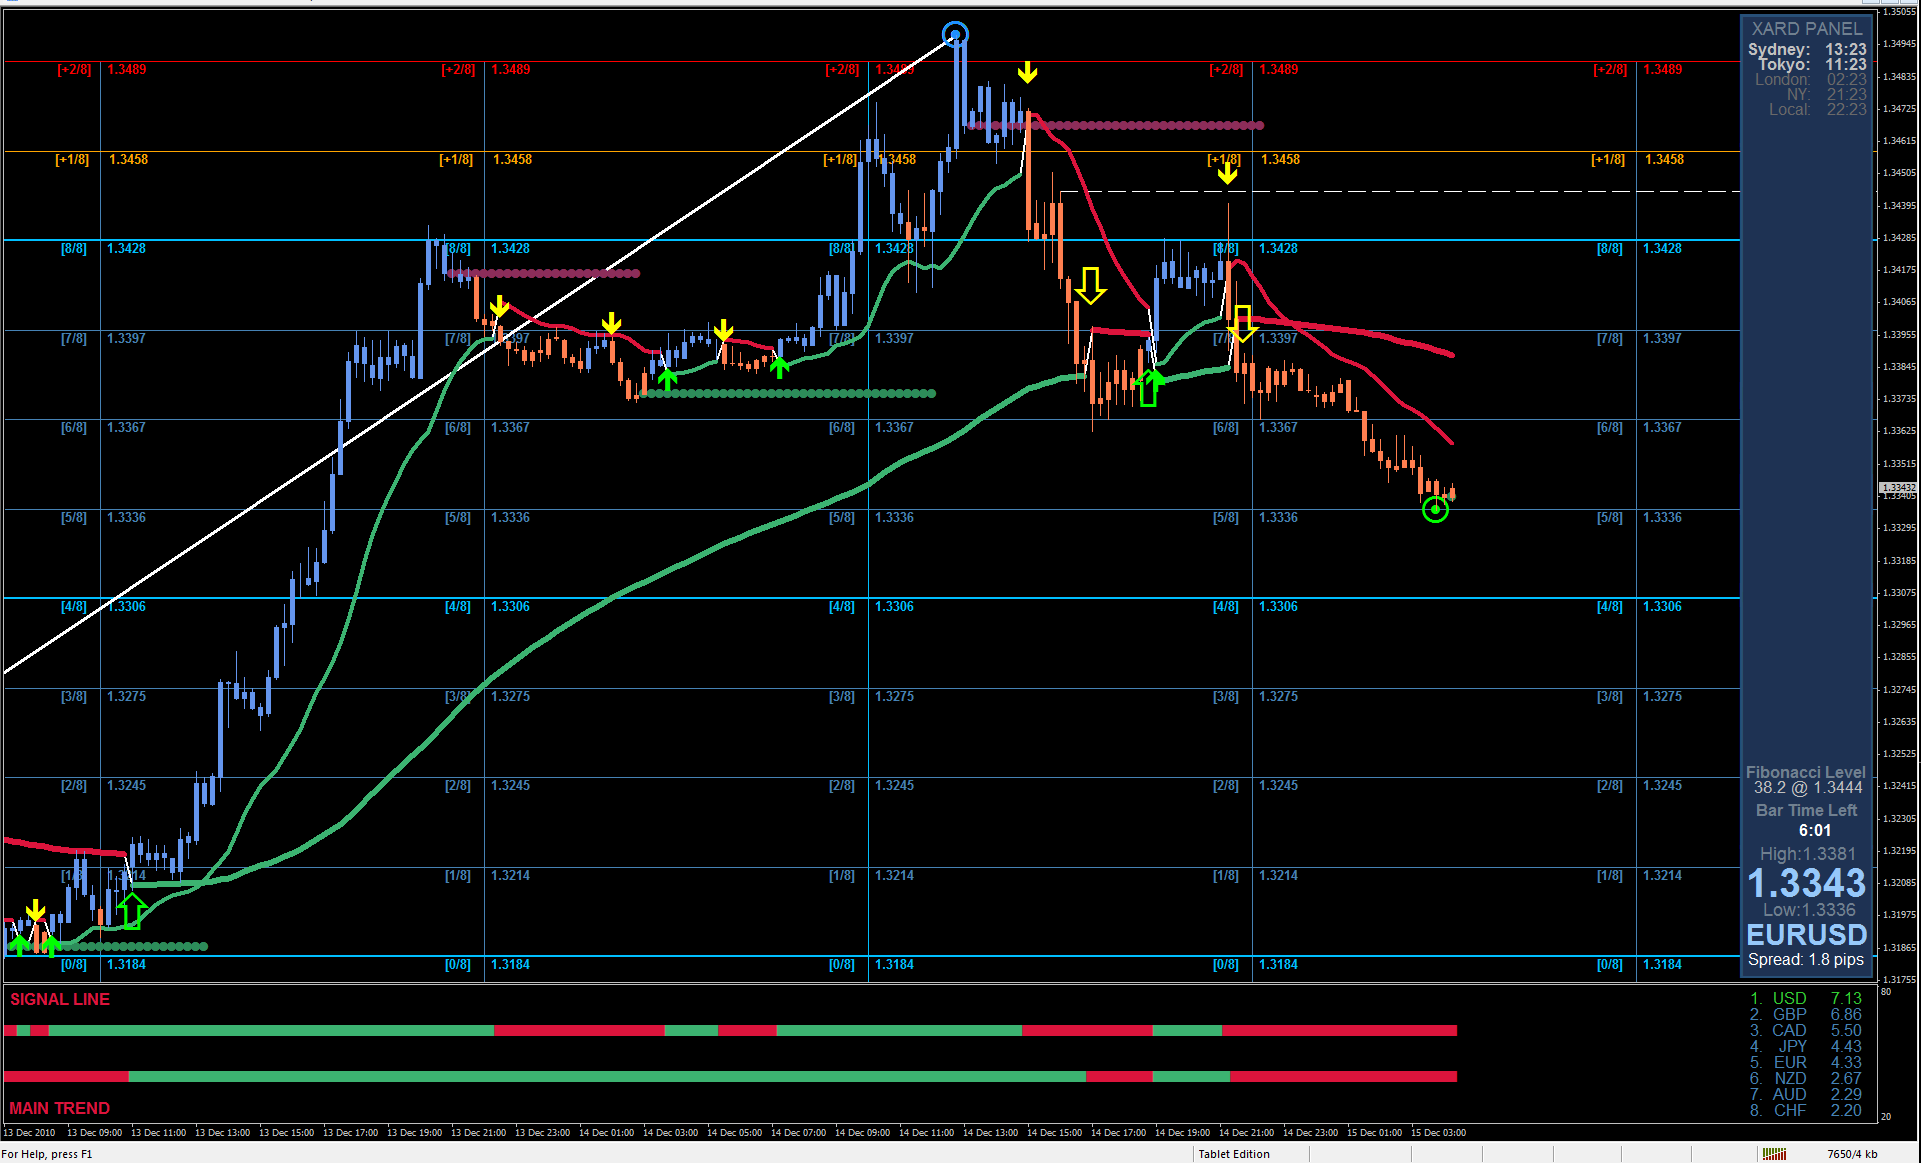
What is reflected in the trading charts?
A candlestick chart view is graphical rectangles of white and black light, with sticks on top and bottom. When analyzing each candle in detail, you will see its characteristics of a relative period: the opening price, closing price, and maximum and minimum prices. Horizontal levels are price coordinates, relative to which a stop or a price reversal may occur. These levels are called support and resistance in the market.
Circles and rectangles are highlighted examples where the price of the story unfolded. This color selection indicates horizontal lines that may put pressure on the quote in the future. The up/down arrows are the reference points of the possible price direction in the future.
*The market analysis posted here is meant to increase your awareness, but not to give instructions to make a trade.
If you have an interest in any area of Forex Trading, this is where you want to be.
Global Fx Trading Group is a world leader in providing Fx services to individual traders, including: Unmatched funding programs, on-line education, virtual trading rooms, automation tools, robot building, and personal coaching.
The company was first established by Jeff Wecker, former member of the Chicago Board of Trade, with 25 years in the industry. Jeff has a keen understanding of the needs of Forex traders and those needs are our focus.
Please join our VIP Group while is still FREE …
https://t.me/joinchat/JqsXFBKpyj3YS4bLWzT_rg
Our mission is simple: To enhance as many lives as we can through education and empowerment.
#theforexarmy #forexsigns #forexsignals #forexfamily #forexgroup #forexhelp #forexcourse #forextrade #forexdaily #forexmoney #forexentourage #forextrading #forex #forexhelptrading #forexscalping #babypips #forexfactory #forexlife #forextrader #financialfreedom