Here are the details of the economic calendar for October 25:
Monday was traditionally accompanied by an absolutely empty macroeconomic calendar. As a result, traders were focused on technical analysis.
Analysis of trading charts from October 25:
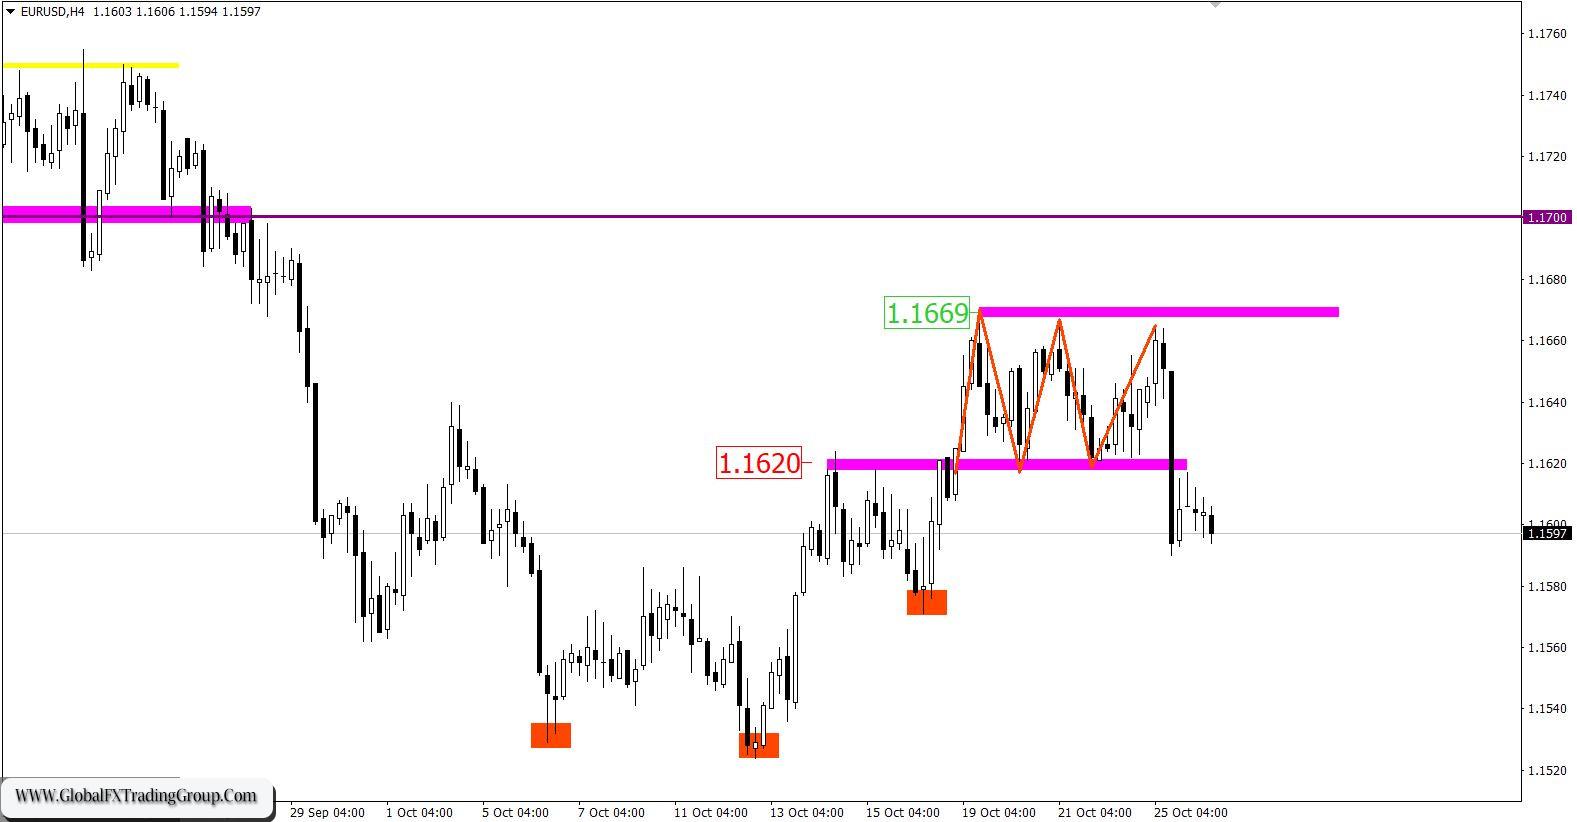
The EUR/USD pair has completed the four-day formation of the side channel of 1.1620/1.1669 by breaking through its lower border. This led to acceleration and speculative activity in the market. A similar scenario of a breakdown of one or another border of the established range was considered in the previous analytical review. Traders were ready to enter short positions when the price was held below the level of 1.1620.
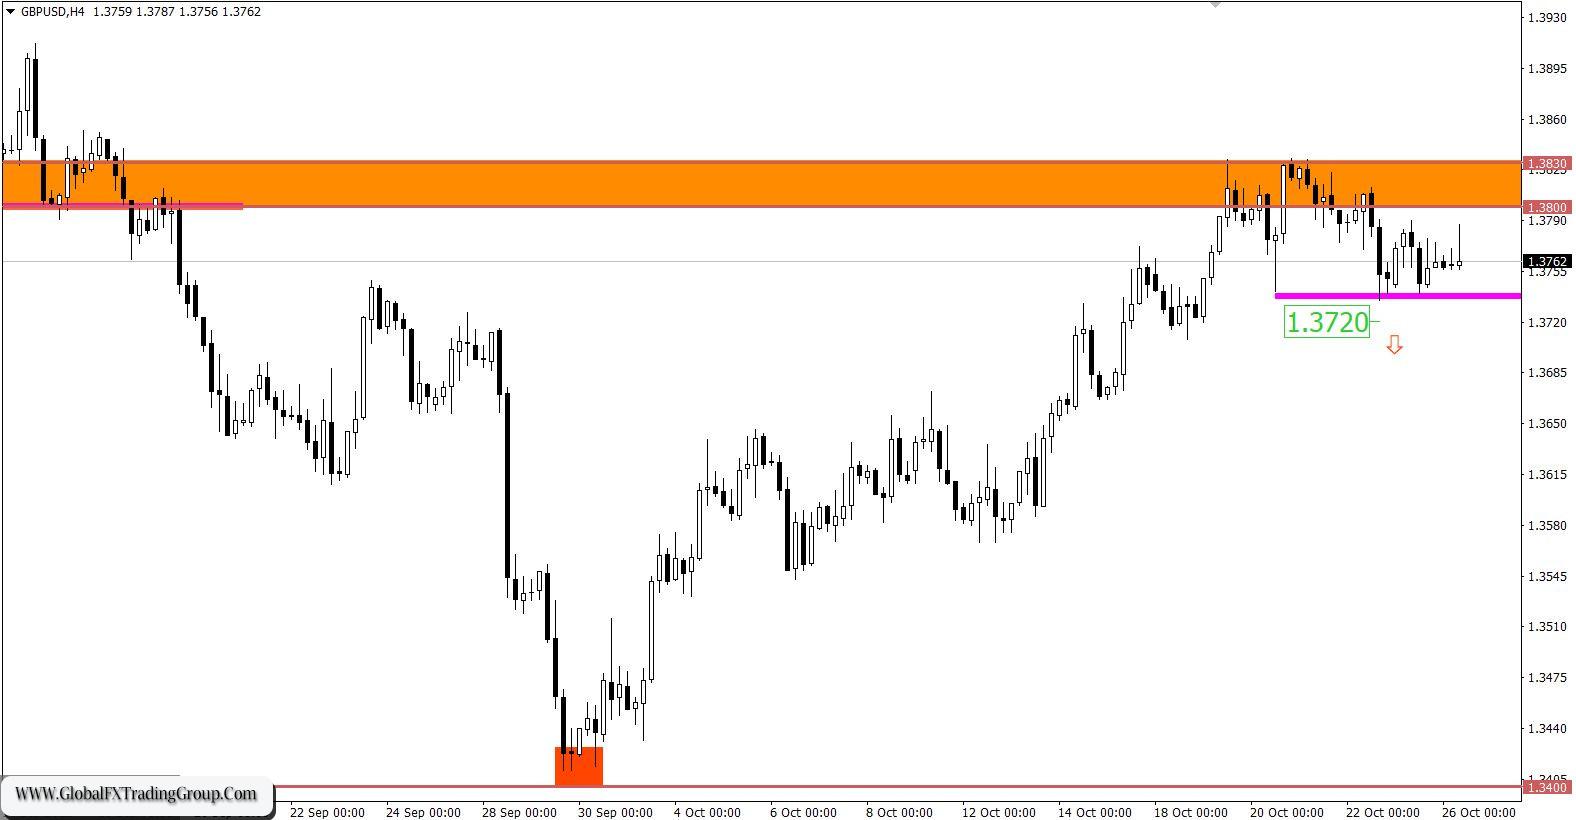
The GBP/USD pair is moving below the resistance area of 1.3800/1.3830, which indicates a slowdown in the correctional course. The pivot point is the October 20’s local low of 1.3741. Previously, it was admitted that stagnation may form if the quote fails to stay below the level of 1.3720.
* The resistance level is the so-called price coordinate, from which the quote can slow down or stop the upward movement. The principle of constructing this level is to reduce the price stop points on the history of the chart, where a price reversal in the market has already taken place.

October 26 economic calendar: The US statistics will be published today, which are not considered very important, but it is still worth paying attention to them. So, the housing price index will be published at 13:00 Universal time, which should grow from 19.9% to 20.1%. At the same time, new home sales may grow by 1% in the September period. The statistics are quite good, which can support dollar positions.
Trading plan for EUR/USD on October 26:
Here, traders are considering a breakdown-pullback scenario relative to the previously broken side channel. The level of 1.1620 serves as a resistance towards the pullback, against which an increase in the volume of short positions may occur. A signal to sell the euro will be received when the price is kept below the level of 1.1590.
Trading plan for GBP/USD on October 26:
Since nothing drastic has happened on the market for the last 24 hours, the expectations regarding the subsequent price development remain the same. The quote will be temporarily squeezed between the level of 1.3740 and the level of 1.3800. This may have a positive effect on the volume of short positions. In this regard, the sell signal can be expected when the price is kept below the level of 1.3720. This scenario considers the pound’s gradual weakening.
What is reflected in the trading charts?
A candlestick chart view is graphical rectangles of white and black light, with sticks on top and bottom. When analyzing each candle in detail, you will see its characteristics of a relative period: the opening price, closing price, and maximum and minimum prices. Horizontal levels are price coordinates, relative to which a stop or a price reversal may occur. These levels are called support and resistance in the market.
Circles and rectangles are highlighted examples where the price of the story unfolded. This color selection indicates horizontal lines that may put pressure on the quote in the future. The up/down arrows are the reference points of the possible price direction in the future.
*The market analysis posted here is meant to increase your awareness, but not to give instructions to make a trade.
If you have an interest in any area of Forex Trading, this is where you want to be.
Global Fx Trading Group is a world leader in providing Fx services to individual traders, including: Unmatched funding programs, on-line education, virtual trading rooms, automation tools, robot building, and personal coaching.
The company was first established by Jeff Wecker, former member of the Chicago Board of Trade, with 25 years in the industry. Jeff has a keen understanding of the needs of Forex traders and those needs are our focus.
Please join our VIP Group while is still FREE …
https://t.me/joinchat/JqsXFBKpyj3YS4bLWzT_rg
Our mission is simple: To enhance as many lives as we can through education and empowerment.
#theforexarmy #forexsigns #forexsignals #forexfamily #forexgroup #forexhelp #forexcourse #forextrade #forexdaily #forexmoney #forexentourage #forextrading #forex #forexhelptrading #forexscalping #babypips #forexfactory #forexlife #forextrader #financialfreedom