Here are the details of the economic calendar for October 28:
All the attention of market participants yesterday was focused on the results of the ECB meeting, where nothing happened. As expected, the regulator kept the parameters of monetary policy. It also left the base interest rate on loans at zero, as well as the rate on deposits at -0.5%. As for the asset repurchase program, its volume remained at 1.85 trillion euros. The ECB will continue to repurchase €20 billion monthly.
Speculators could have considered the words that the quantitative easing program would be completed in March 2022, but the regulator stated this during the previous meeting. Therefore, there should not have been an extraordinary reaction. In this situation, there may have been an interweaving of the information and news flow, where the ECB did nothing, and the US GDP data turned out to be several times worse than the forecast. So, the preliminary estimate of GDP for the third quarter was expected to slow down from 12.2% to 4.9%, but the data came out even worse – 2.7%
Analysis of trading charts from October 28:
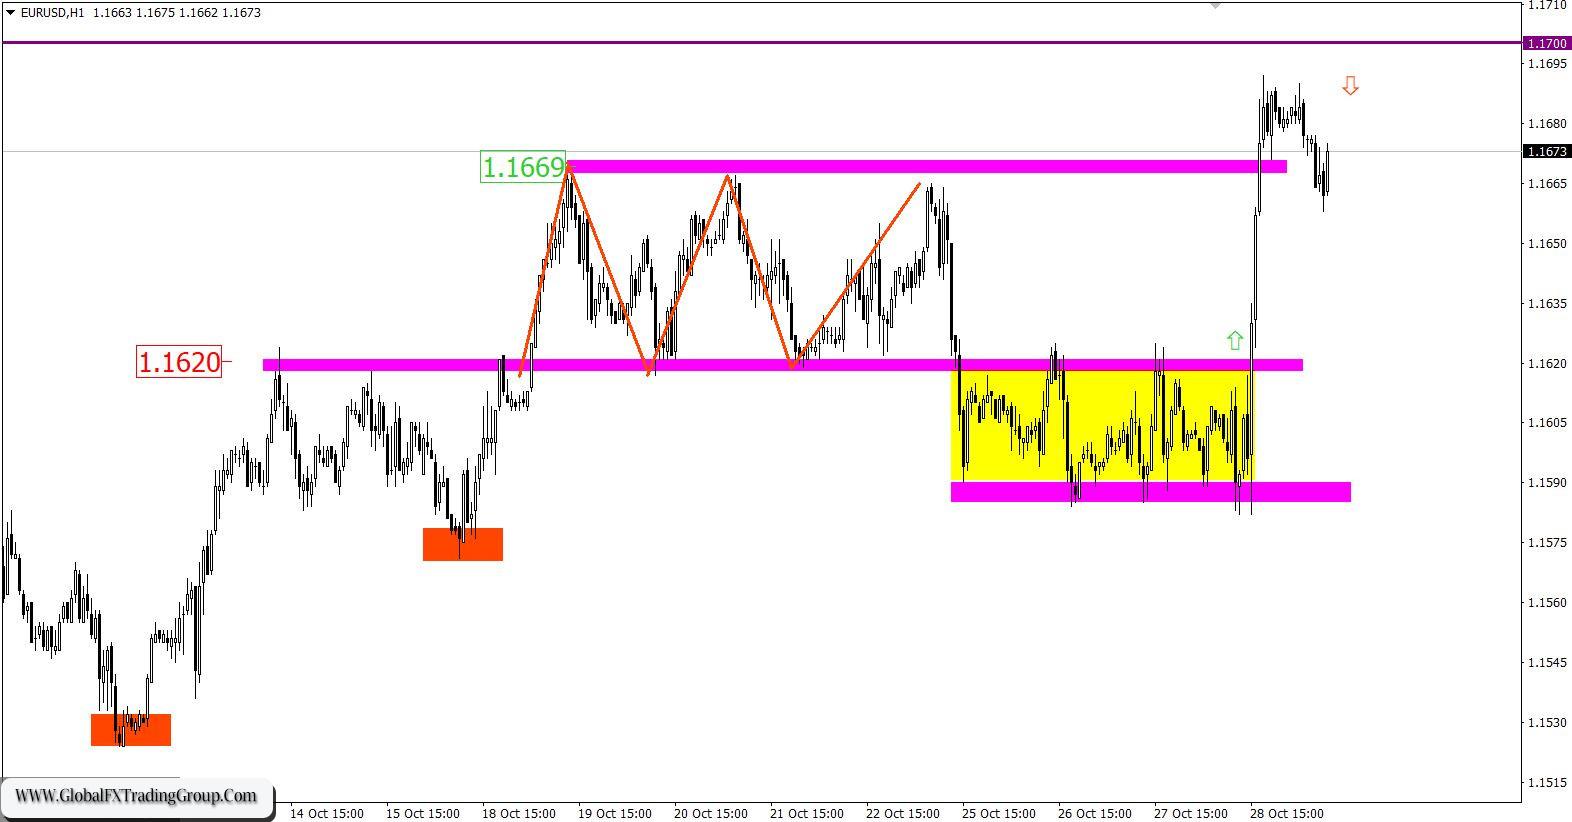
The EUR/USD pair showed high activity after a short stagnation in the range of 1.1585/1.1625, breaking through the upper limit of the flat on the way. Speculative interest was caused by the information and news flow, which led to an inertial move of 100 points. In the previous analytical review, a trading method based on the breakdown of one or another border of the established range of 1.1585/1.1625 was considered. This made it possible to enter buy positions almost at the beginning of the inertial movement.
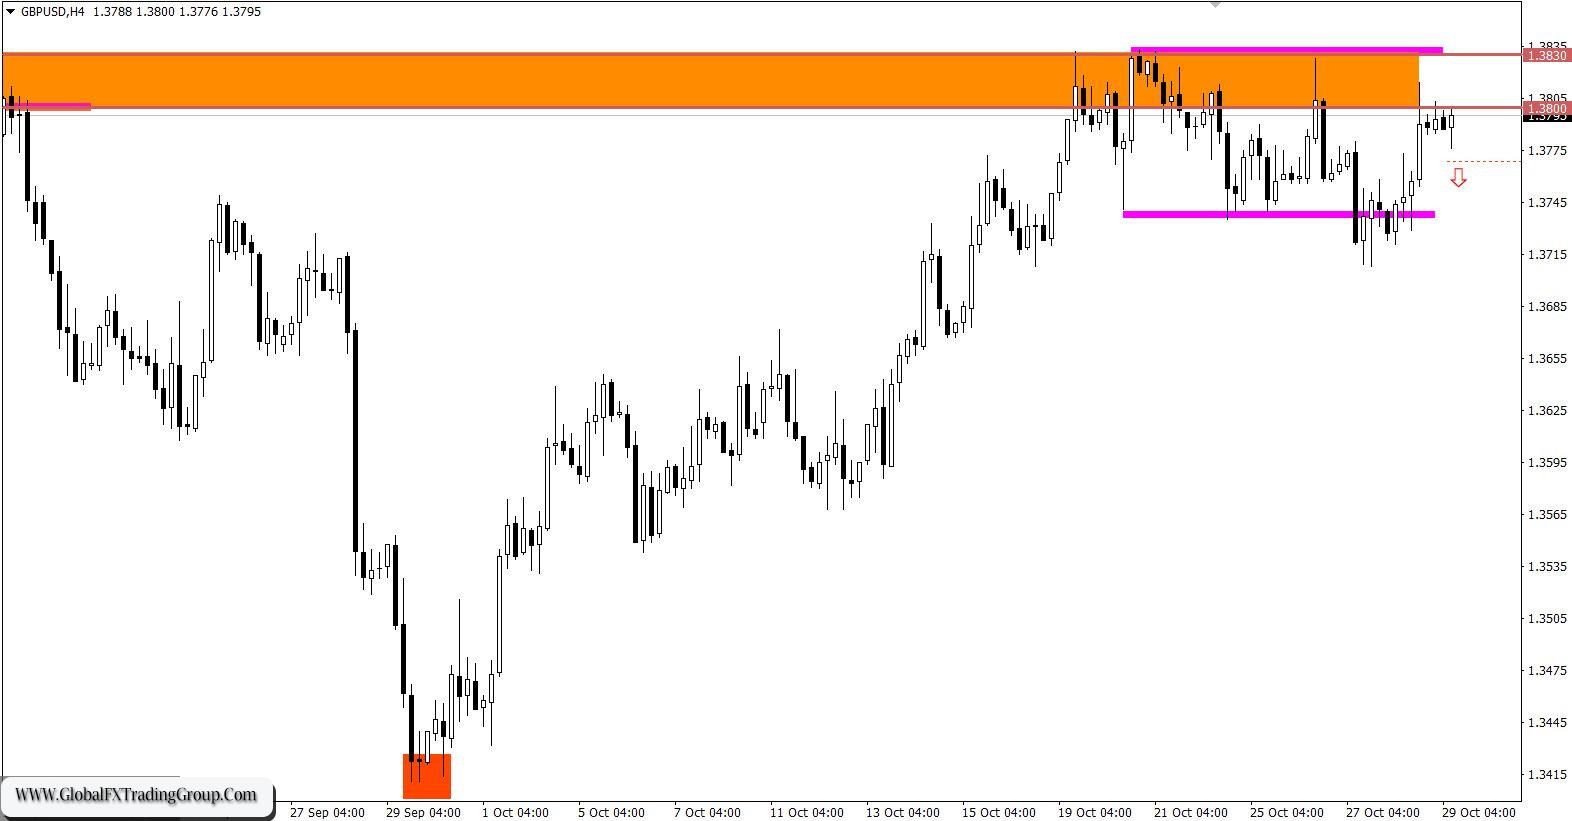
There was no change of trading interests for the GBP/USD pair. The local low of October 18 acted as support, returning the quote to the area of the resistance level of 1.3800/1.3830. Such a scenario of market development was expected, so we took it into account in the previous review.

October 29 economic calendar: Europe’s preliminary data on inflation will be published today, where consumer prices are expected to rise from 3.4% to 3.7%. Taking into account the ECB’s silence, further inflation growth may cause concern among investors. Moreover, the rate of economic growth in Europe may slow down from 14.4% to 3.7%. According to the statistics, the euro may be hit by sellers.
Trading plan for EUR/USD on October 29:
During the inertial movement, the quote approached the resistance level of 1.1700, where there was a reduction in the volume of long positions and a pullback. It can be assumed that sellers have a chance to return the quote to the level of 1.1625 considering the signal about the overbought euro and the resistance level. The signal to sell the euro will arrive when the price is kept below the level of 1.1650. Traders will consider an alternative scenario of market development if the price is kept above the 1.1700 level in a four-hour period. This will lead to the subsequent construction of a corrective course.
Trading plan for GBP/USD on October 29:
The resistance area of 1.3800/1.3830 continues to put pressure on buyers, which may lead to a price rebound followed by the formation of a side channel of 1.3730/1.3830. An alternative scenario will be relevant if the price is kept above the level of 1.3840. In this case, the buyers of the pound will have a second chance after a two-week stop.
What is reflected in the trading charts? A candlestick chart view is graphical rectangles of white and black light, with sticks on top and bottom. When analyzing each candle in detail, you will see its characteristics of a relative period: the opening price, closing price, and maximum and minimum prices. Horizontal levels are price coordinates, relative to which a stop or a price reversal may occur. These levels are called support and resistance in the market.
Circles and rectangles are highlighted examples where the price of the story unfolded. This color selection indicates horizontal lines that may put pressure on the quote in the future. The up/down arrows are the reference points of the possible price direction in the future.
*The market analysis posted here is meant to increase your awareness, but not to give instructions to make a trade.
If you have an interest in any area of Forex Trading, this is where you want to be.
Global Fx Trading Group is a world leader in providing Fx services to individual traders, including: Unmatched funding programs, on-line education, virtual trading rooms, automation tools, robot building, and personal coaching.
The company was first established by Jeff Wecker, former member of the Chicago Board of Trade, with 25 years in the industry. Jeff has a keen understanding of the needs of Forex traders and those needs are our focus.
Please join our VIP Group while is still FREE …
https://t.me/joinchat/JqsXFBKpyj3YS4bLWzT_rg
Our mission is simple: To enhance as many lives as we can through education and empowerment.
#theforexarmy #forexsigns #forexsignals #forexfamily #forexgroup #forexhelp #forexcourse #forextrade #forexdaily #forexmoney #forexentourage #forextrading #forex #forexhelptrading #forexscalping #babypips #forexfactory #forexlife #forextrader #financialfreedom