Here are the details of the economic calendar for Sept 29:
During the previous day, the UK lending market data was published. And although the number of approved mortgage loans declined from 75.13 thousand to 74.45 thousand, the volume of mortgage lending rose by 5.3 billion pounds. In addition, the volume of consumer lending, reflecting the dynamics of consumer activity, and therefore the prospects for economic growth, increased by 0.351 billion pounds, which is better than the expected growth of only 0.30 billion pounds. However, positive data on the lending market did not help the British currency, which continued to decline. The reason for the sale of the pound sterling lies in the ongoing energy crisis.
Analysis of trading charts from September 29:
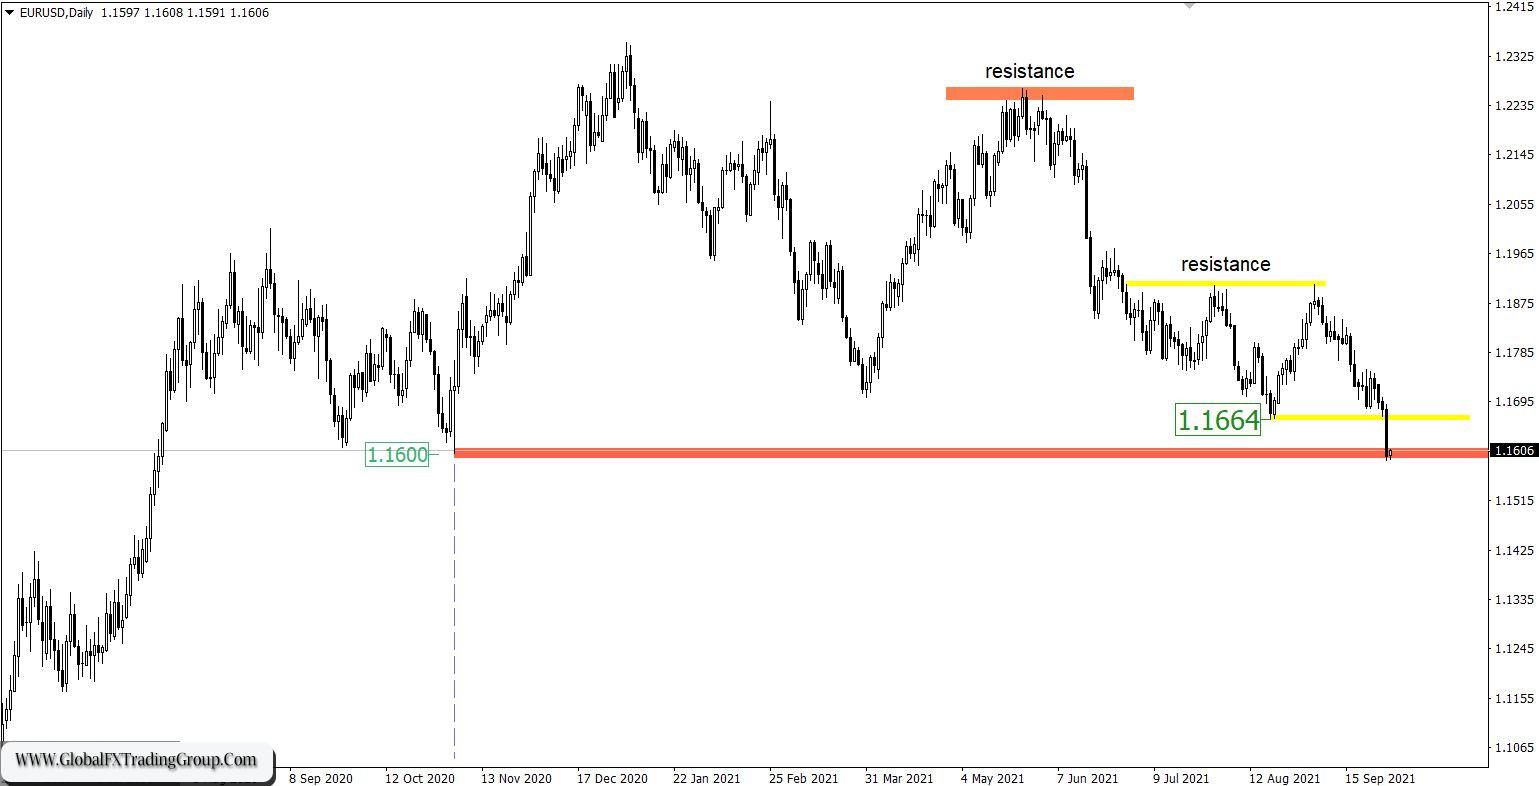
The EUR/USD pair showed a fairly strong downward interest, falling by more than 80 points. As a result, sellers managed to initially break through the local low of August 20 – 1.1664, and later approached the low of November 2020 – 1.1600. Based on the daily period, a prolongation of the cycle is visible, descending from the beginning of June, where bears occupy a leading position in the market. The trading plan on September 28 and 29 considered the next decline, where the signal to enter sell positions was the price holding below the level of 1.1660.
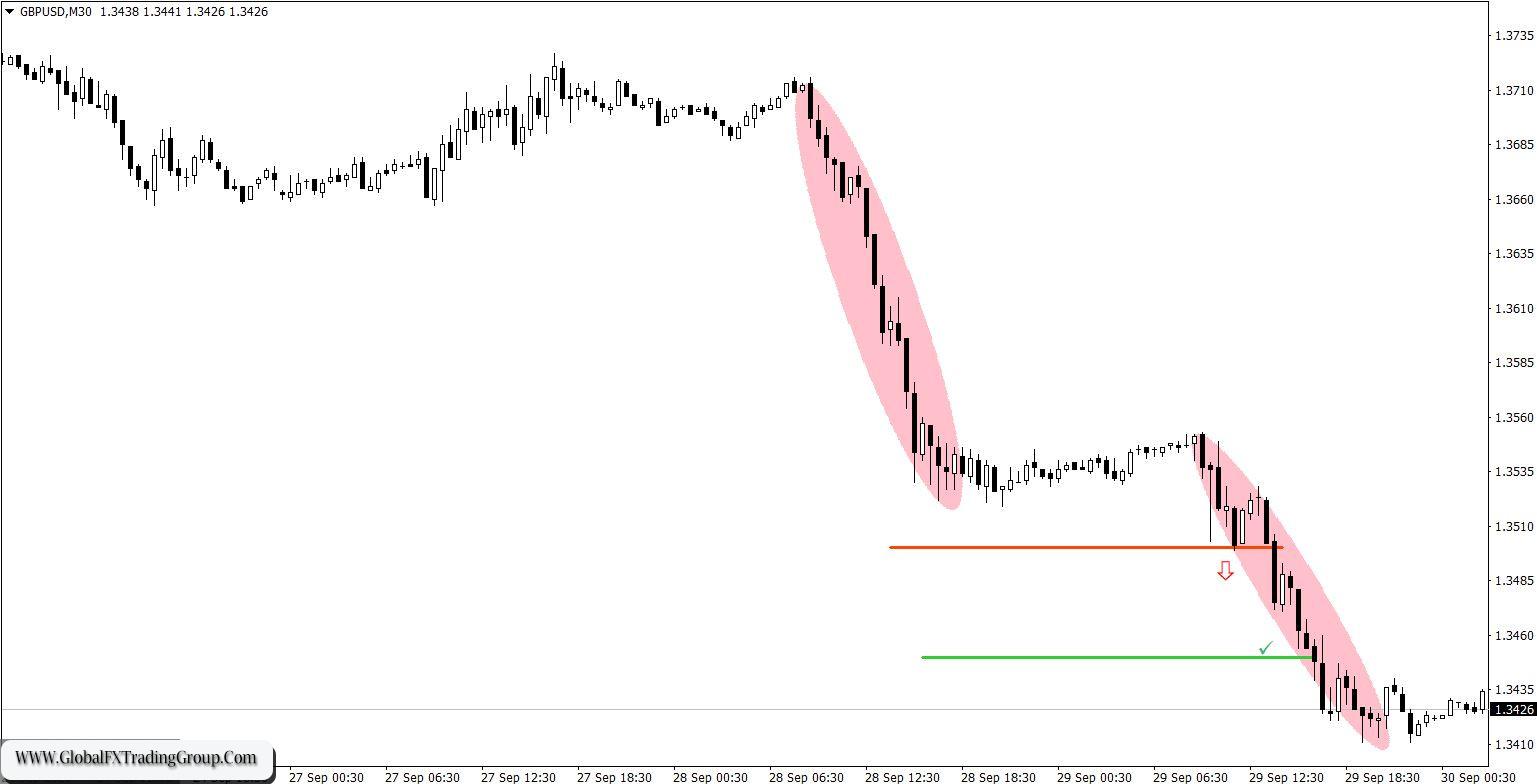
The pound sterling lost more than 2% of its value in two trading days, which is a very strong price change in a short period of time. As a result, the downward cycle was not just prolonged, but the medium-term trend was hit by a change in trading interest. Trading on the decline of the British currency has been going on for a long time and we have already managed to take most of the profit from the market. Relative to the previous day, a subsequent decline was considered if the price was kept below the level of 1.3500. The profit-taking point was at the level of 1.3450. As a result, we managed to close the deal in the positive zone again.
* A change of trading interests is when there is a change of direction in the market from ascending to descending or from descending to ascending.
September 30 economic calendar:
The UK’s final GDP data for the second quarter have already been published at 6:00 Universal time today, which suddenly turned out to be better than the preliminary estimate. As a result, the -6.1% economic decline was replaced by a 23.6% growth. The data is positive, but due to the pound’s sell-off in the market, there is no proper reaction yet. During the US trading session, the final GDP data is also expected, but this time for the United States, which should confirm the acceleration of economic growth from 0.5% to 12.2%. At the same time, weekly data on applications for unemployment benefits in the United States will be published, where they predict a reduction in their volume.
Details of statistics: The volume of initial applications for benefits may decline from 351,000 to 335,000. The volume of repeated applications for benefits may decline from 2,845 to 2,800.
* Applications for unemployment benefits reflect the number of currently unemployed citizens and those receiving unemployment benefits. This indicator is considered to be the state of the labor market, where the growth of the indicator negatively affects the level of consumption and economic growth. The reduction of applications for benefits has a positive effect on the labor market.
Trading plan for EUR/USD on September 30:
The oversold status* together with the support level of 1.1600 may well lead to a reduction in the volume of short positions, which will lead to a technical correction. At the same time, a high level of speculative interest may block signals from technical analysis and lead to a further decline. In this case, holding the price below the level of 1.1590 may indicate an increase in the volume of short positions.

Trading plan for GBP/USD on September 30:
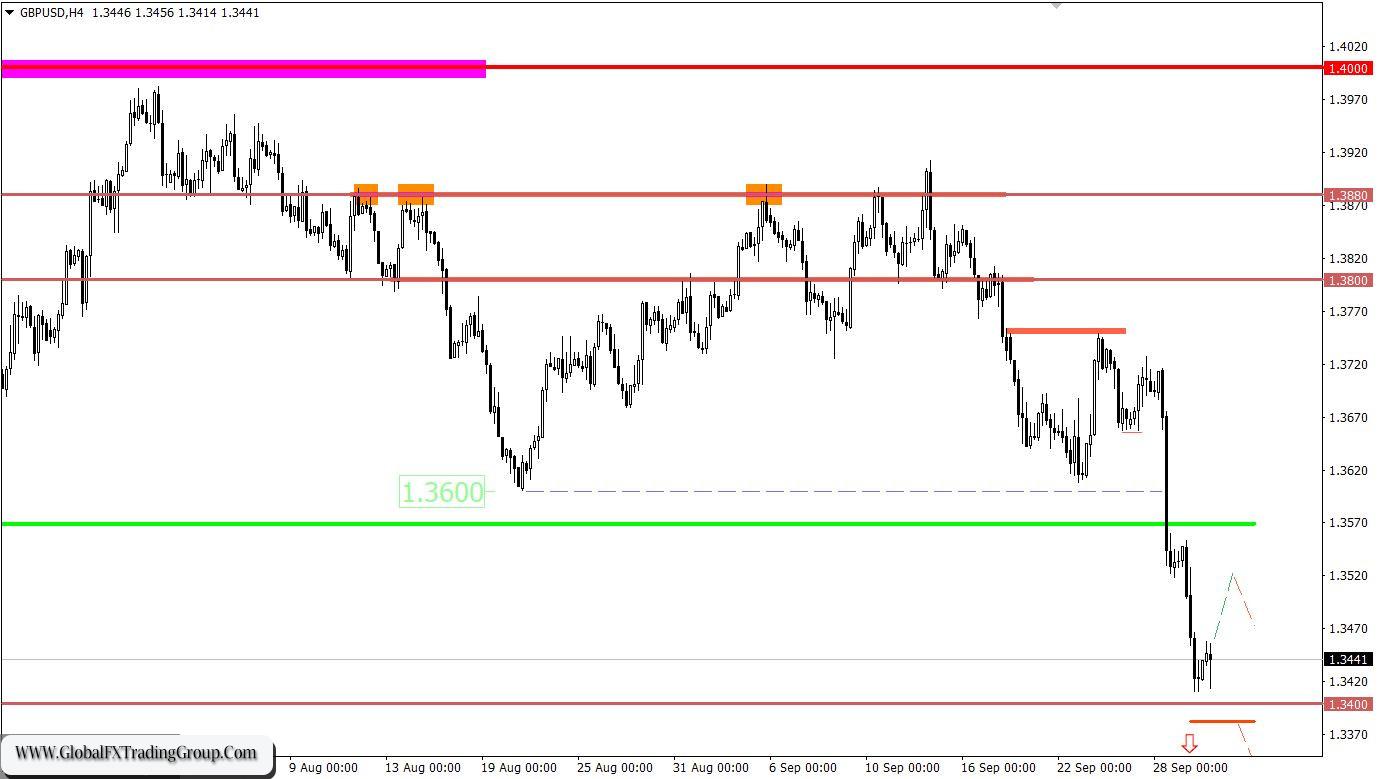
The situation of the GBP/USD pair s exactly the same as its European counterpart. There is a high oversold level, which increases the chance of a technical correction in the market. This scenario will lead to a price rebound from the support area of 1.3400 towards the range of 1.3500-1.3520. At the same time, it is impossible to exclude the occurrence of another speculation, where a new downward interest will arise if the price is kept below the level of 1.3400, which will lead to the pound’s further weakening.
* Oversold market – a situation where prices have dropped too low and quickly. In this case, we are talking about the euro and the pound, which have lost almost 80 and 270 points from the value in a short period of time.
* The support level is the so-called price coordinate, from which the quote can slow down or stop the downward course. The principle of constructing this level is to reduce the points of support on the history of the chart, where a price reversal in the market has already taken place.
It is worth considering that the support level cannot be eternal and constantly lead to a price reversal. Therefore, traders always have an alternative scenario for the development of the market, which considers the breakdown of this level.
• Short positions or Short means sell positions.
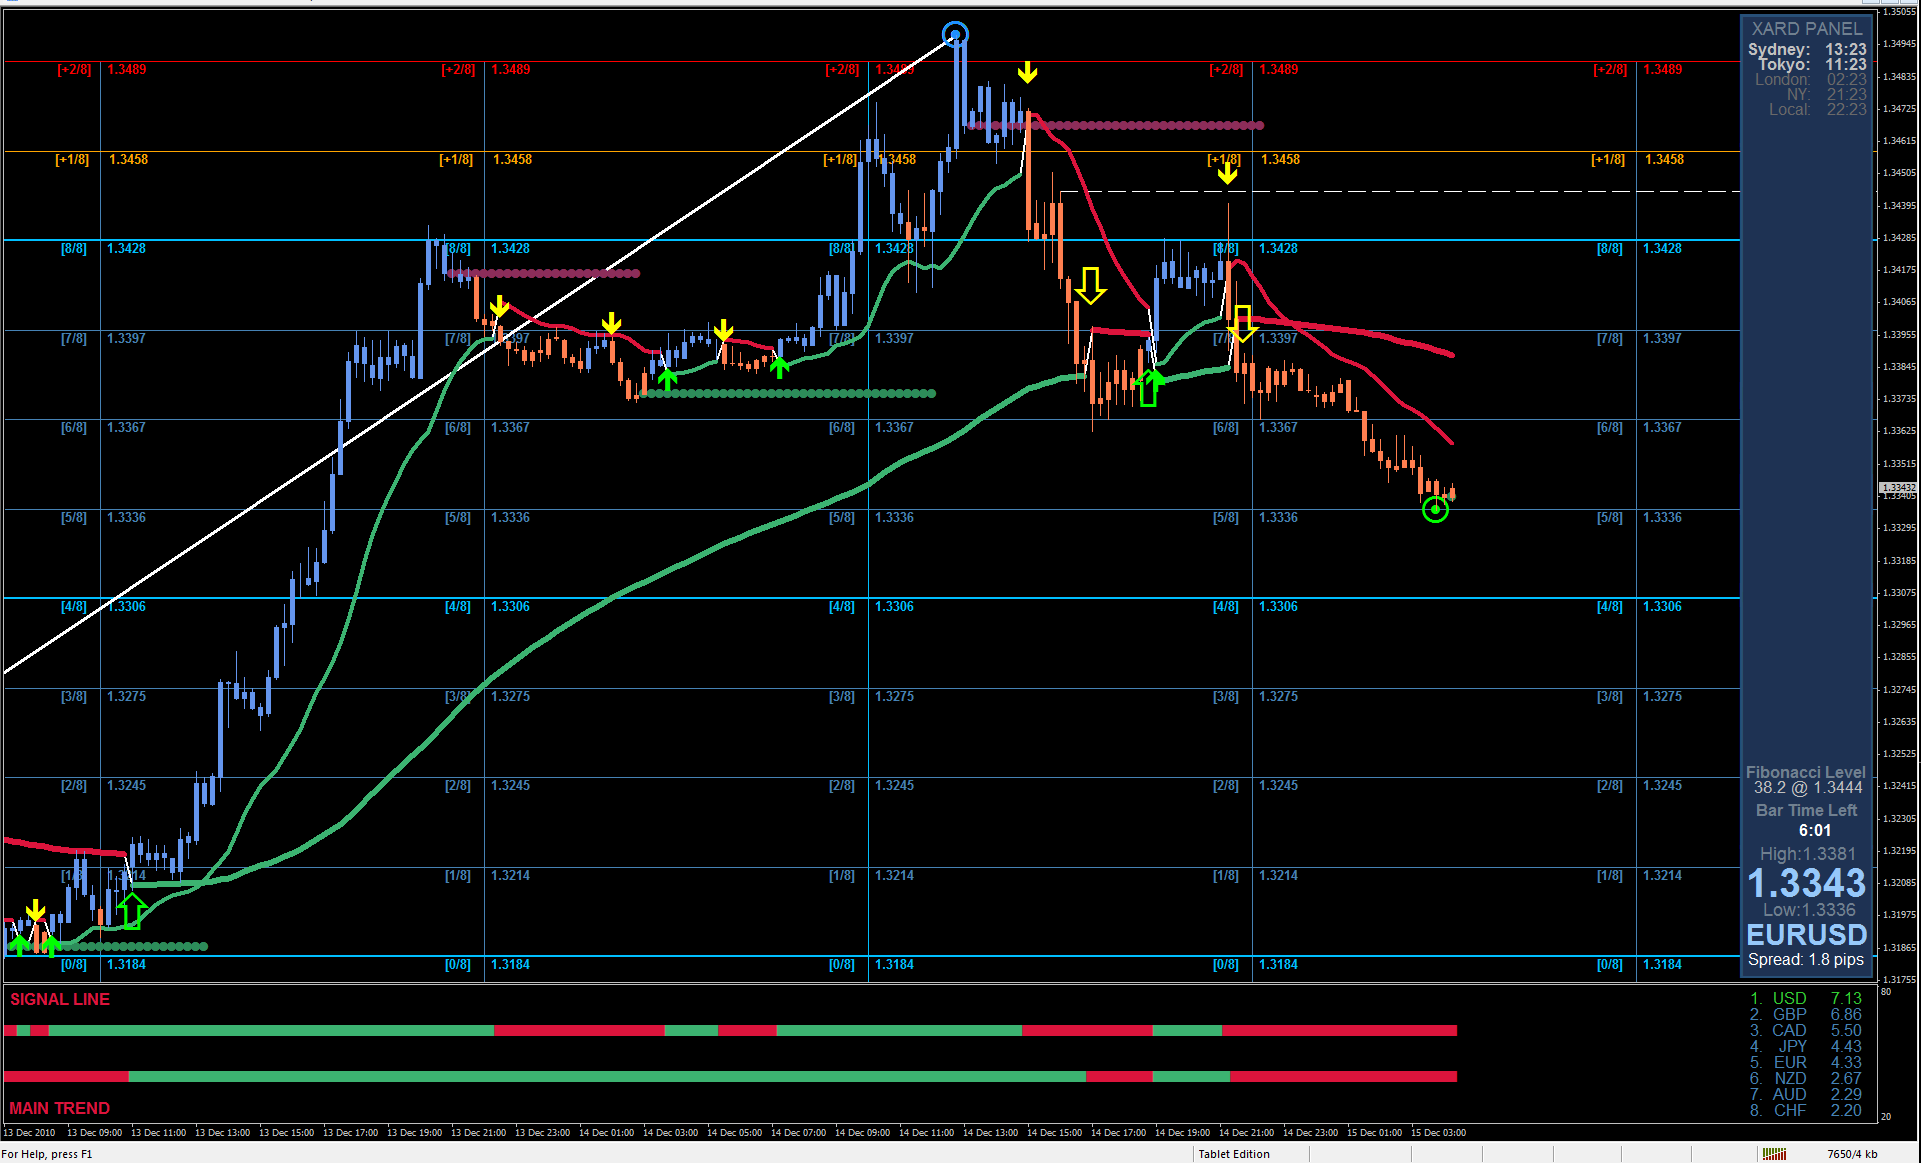
What is reflected in the trading charts? A candlestick chart view is graphical rectangles of white and black light, with sticks on top and bottom. When analyzing each candle in detail, you will see its characteristics of a relative period: the opening price, closing price, and maximum and minimum prices. Horizontal levels are price coordinates, relative to which a stop or a price reversal may occur. These levels are called support and resistance in the market. Circles and rectangles are highlighted examples where the price of the story unfolded. This color selection indicates horizontal lines that may put pressure on the quote in the future. The up/down arrows are the reference points of the possible price direction in the future.
Golden Rule:
It is necessary to figure out what you are dealing with before starting to trade with real money. Learning to trade is so important for a novice trader because the market is constantly dynamic and it is important to understand what is happening.
*The market analysis posted here is meant to increase your awareness, but not to give instructions to make a trade.
If you have an interest in any area of Forex Trading, this is where you want to be.
Global Fx Trading Group is a world leader in providing Fx services to individual traders, including: Unmatched funding programs, on-line education, virtual trading rooms, automation tools, robot building, and personal coaching.
The company was first established by Jeff Wecker, former member of the Chicago Board of Trade, with 25 years in the industry. Jeff has a keen understanding of the needs of Forex traders and those needs are our focus.
Please join our VIP Group while is still FREE …
https://t.me/joinchat/JqsXFBKpyj3YS4bLWzT_rg
Our mission is simple: To enhance as many lives as we can through education and empowerment.
#theforexarmy #forexsigns #forexsignals #forexfamily #forexgroup #forexhelp #forexcourse #forextrade #forexdaily #forexmoney #forexentourage #forextrading #forex #forexhelptrading #forexscalping #babypips #forexfactory #forexlife #forextrader #financialfreedom